Proactive Insight for Collection System Management
https://youtu.be/JjnFhtAnrqI?si=GuDd0LnWnsvd6uGv
PRISM™ is ADS’s revolutionary new advanced web application that puts critical data at your fingertips to support management, engineering, and operational decisions within your wastewater collection system. PRISM connects clients to any monitoring network, delivering near real-time operational intelligence on the status of your wastewater collection system. It is the fastest and easiest way to visualize the condition of your collection system. It offers dynamic analytical functions to fuel discoveries that will lead to the enhanced management of your system.
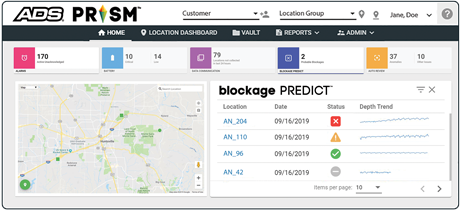
Access your data and device status on this new cloud-based Collection System Management platform. The home page provides immediate system insight including a map view reflecting flow, level, and rainfall monitors with location and condition details, leaderboard tiles with system status, and quick access to the data vault as well as specialized reports. The intuitive interface allows you to quickly manage alarms, check collection and device status, generate reports, and link third party data through our self-service API to automate and enhance your specific workflow.

Visualize sewer system performance through intuitive dashboards and graphical displays

Transform data into actionable insight with powerful analytics

Ensure timely performance notifications with configurable alarms for advance notice of developing problems

Provides an easy and transformative user experience
for sewer data management

Collaborate for success by sharing data, reports, and related files among cross-functional groups
PRISM Resources
PRISM Literature
ADS API Overview
PRISM Literature

PRISM Literature
>> Download PRISM Literature
ADS API Overview

ADS API Overview Information
Overview of ADS’s Self-Serve API (Advanced Programming Interface).
>> Download the API Overview Sheet

Detect Sewer Blockages Early

Detect Sewer Blockages Early
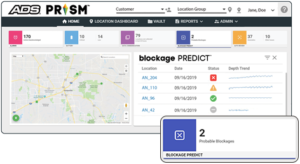
ADS has developed blockage PREDICT™ to detect the earliest signs of blockages – allowing sewer cleaning resources to be deployed at the right place at the right time in a proactive manner.
Detect Infiltration & Inflow

Detect Infiltration & Inflow
SLiiCER® is the Newest ADS I/I Analytics App
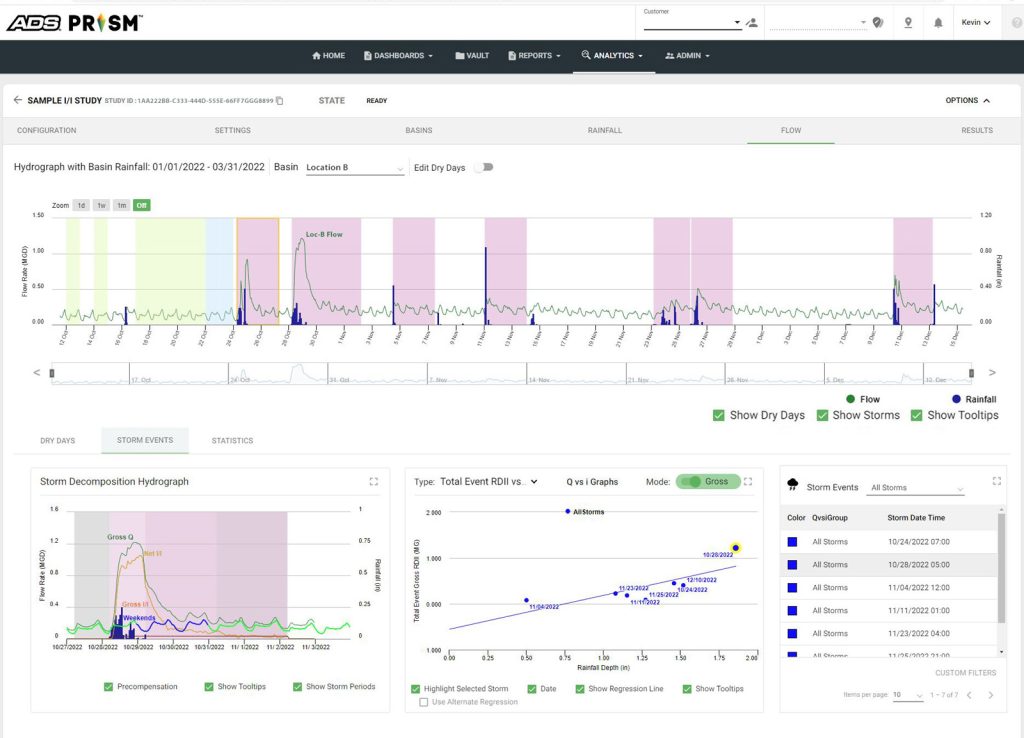
The new SLiiCER in PRISM™ puts the power and control of your Infiltration and Inflow (I/I) studies directly in your hands, providing the industry’s most trusted and complete I/I evaluation solution. SLiiCER makes it easy to evaluate your entire collection system as a single solution, tracking down I/I to guide rehabilitation programs, eliminate overflows, and validate results. The SLiiCER app, as a valuable addition to the ADS PRISM platform, leverages the power of seamless data integration, trusted analytics, and flexible reporting in a single, unified platform.

SLiiCER Page
PRISM FAQS
Q1. What is the URL for PRISM™?
A1. The URL is: https://www.adsprism.com.
Q2. Are there any PRISM instructional videos available?
A2. Yes. Go to http://www.adsenv.com/video-library.
Q3. Should I use a particular internet browser?
A3. You will get the best user experience viewing PRISM with Google® Chrome® or Firefox®.
Q4. Can I create new User accounts in PRISM?
A4. Yes. If you have the appropriate user permission, click on USERS under the ADMIN tab. Then choose the Add New User icon in the lower left.
Q5. I forgot my password. Can I reset it?
A5. Yes, in the PRISM login area, enter your User Name and click on “Forgot Password”. You will be prompted to enter your User Name or an Email address. Click the “I’m not a robot” and answer the question; then click RESET.
Q6. Can I set PRISM so that the same customer is selected each time I open PRISM?
A6. Yes. You can set a customer as your Favorite so that each time you log in to PRISM that customer will be the one to display. To do this, choose your user name from the upper right corner of the PRISM window and then User Preferences. Select the customer you wish to be your Favorite. Click the star to save this as your favorite customer; a gold star indicates the favorite customer; a hollow star indicates that the customer is not the favorite.
Q7. Can I add a Location from the Home page rather than going to the Customer Editor?
A7. Yes. Select the Action in the bottom left-hand corner of the Map (Home page). Select the Add Location icon.
Q8. Can I create a Composite Location in PRISM?
A8. Yes. Select the Action in the bottom left-hand corner of the Map (Home page). Select the Add Composite Location icon.
Q9. What does the Data Communication tile represent?
A9. The Data Communication tile displays the number of locations that had no data collection (by polling or data delivery) within the last 24 hours.
Q10. KML layers were uploaded to my PRISM project. How do I display them on the Map?
A10. Once KML layers are uploaded to a project, a new Layers icon is available on the right side of the Map under the Legend icon.
Q11. Can PRISM display KML layers on the MAP?
A11. Yes. The KML feature must be turned on for the given project. KML files (3MB or less) can be uploaded to the project. Contact the ADS Customer Support Center for assistance.
Q12. How do I create a new Customer?
A12. If you have the appropriate user permissions, select the Customer Editor icon to the right of the Customer drop-down list. Then choose the Add New Customer icon in the lower right.
Q13. Can I change the units of measure for a customer in PRISM? If so, what units are available?
A13. Yes. Units of measure selection are available through the Customer Editor located to the right of the Customer drop-down list. Select the appropriate customer and Edit. The Units drop-down list on the Edit Customer window includes three choices: US Standard MGD (reports depth in inches, velocity in feet per second and flow rate in MGD; US Standard CFS (reports depth in inches, velocity in feet per second and flow rate in CFS) and Metric (reports depth in millimeters, velocity in meters per second and flow rate in liters per second).
Q14. Can time be displayed in the 24-hour format?
A14. Yes. Time can be displayed in either a 12-hour or 24-hour format. Choose Customer Editor icon located to the right of the Customer drop-down list. Select the appropriate customer and Edit. Choose the desired time format from the Time Format drop-down.
Q15. My Customer wants the Date Format in PRISM to be in the Year/Month/Date format versus the typical Month/Day/Year. Is that possible?
A15. Yes, there is a Date Format setting and the project can be set to that Year/Month/Date preference.
Q16. What is the meaning of “Is Active” on the Location Properties page?
A16. When the Is Active option is set to Yes, the associated location is considered active in PRISM. Active locations can be included in scheduled data collects. If Is Active is set to No, the location is removed from any scheduled collect and will only display in the interface if you choose the Display All Locations icon (located in the upper right corner of PRISM, to the left of your user name).
Q17. How do I access graphical data from the Home page?
A17. You can access graphical data from the Home page through the Location Properties page. Select a location through the map’s Search Location option or by choosing the map icon. Once the Location Properties page displays, select the graph symbol located at the bottom of the page to open the Location Dashboard.
Q18. Can I activate ADS flow monitors in PRISM?
A18. Yes. PRISM supports the activation of ADS ECHO™ and RainAlert® III monitors. Open the Location Properties screen for the monitor you wish to activate and select the Activate icon.
Q19. Can I back collect a location?
A19. Yes. Choose the on-demand Collect button from the Location Properties card on the HOME screen; enter the Start and End Dates for your collect period.
Q20. We pulled a monitor from one location and relocated it to a new one. Should I set the old location to INACTIVE?
A20. Yes. That way the new location will not populate its data into the old location.
Q21. Can I display Alarm Thresholds for alarming locations on the Home screen?
A21. Yes. Click on the graph link on the Alarms Widget, the alarm thresholds now display.
Q22. Can I review historical alarms for a given location?
A22. Yes, click on the Alarms Tile to open the Alarm Widget. Click on the Filter and select the type of Alarm, Date and Location of interest. The historical alarm information will display in the widget.
Q23. Can I not save the parameters I enter to generate graphs? I do not want to enter the same information each time I graph the data.
A23. The ability to save templates is recognized as needed and will be available in PRISM in the near future.
Q24. Can I change the data entity colors on the Locations Dashboard?
A24. No. At this time a user cannot change the entity colors.
Q25. Can I select multiple locations to print graphs?
A25. No, not at this time. Each graph must be printed individually.
Q26. Can I plot Iso-Q lines, as well as the pipe overlay in the scattergraph view?
A26. Yes. In the upper right corner of the Locations Dashboard, open the Settings panel (three vertical dots) and set the Scattergraph Annotations on for Iso-Q lines and Pipe Overlay.
Q27. Is there a way to plot Rain on top of the hydrograph rather than at the bottom?
A27. Yes. In the upper right corner of the Locations Dashboard, open the Settings panel (three vertical dots) and set the Hydrograph Annotations on for Rain on Top.
Q28. Can I zoom in to hydrograph data?
A28. Yes. There are selection buttons for 1 day, 1 week, 1 month at the top of each graph OR you can manually drag the slider below the hydrograph.
Q29. Can I plot multiple locations on one graph?
A29. Yes. You can create graphs with multiple locations in the Custom Dashboard.
Q30. Under the Locations Dashboard, the Scattergraph plots Depth versus Velocity. Can I invert that?
A30. Yes. In the upper right corner of the Locations Dashboard, open the Setting panel (three vertical dots) and set the Scattergraph Annotations on for Invert Scatter Axis.
Q31. How do I get an xml file for my location to import into PRISM?
A31. If you activate an ADS TRITON+, ECHO or RainAlert III monitor using ADS Qstart 1.9 or higher, an .xml file is generated in the location folder. Use this file to import into PRISM.
Q32. There is a gap in the monitor data. How can I fill in this gap?
A32. Import a csv data file from ADS Profile or Qstart to fill in the data gap or back-collect the data through the Location Properties Card.
Q33. What data is displayed on the Daily Summary Report?
A33. The Daily Summary Report reports the previous days’ Maximum, Minimum and Average depth and velocity data and the previous days’ Maximum, Minimum, Average flow rate and the Total Flow volume.
Q34. How can I see more summary data from the monitoring locations?
A34. Click on the location name on the Data Summary Report. A new screen will open showing minimums, maximums, averages and flow total for the past seven days. You can use the filter icon next to DOWNLOAD to define a new time period to view or change the data entities displayed in the report.
Q35. What are the Uptime Report values based on?
A35. The Uptime Report values are based on the data availability from the previous calendar day for UNIDEPTH, VELOCITY and Qcontinuity.
Q36. Why does my uploaded location xml file not display in PRISM?
A36. To import a new or updated location xml file, you must first upload the file using the Vault > UPLOAD > Location feature. Second locate the imported file and select Import to add the file to the PRISM database.
Q37. Can I import a .LIF file into PRISM?
A37. No. PRISM supports the import of .xml location files only.
Q38. Where can I find the files that I export from the Location Dashboard?
A38. All PRISM exported data files are placed in a folder named dataExports in the Vault.
Q39. Is there a limit to the number of files I can store in the Vault?
A39. No. There is no limit to the number of files a user can store at this time.
Q40. Is there a limit to the file size I can upload to the Vault?
A40. Yes. The file must be less than 20 MB in size.
Q41. What types of files can I upload to the Vault?
A41. There are three categories of files you can upload to PRISM: Files, Location and Data. Select Files to import a document, for example site reports, location pictures, Microsoft® Word® or Excel® documents. Select Location to import a location xml file from Qstart. Select Data to import a csv data file in the ADS file format.
Q42. Can I export the RAIN entity from multiple rain gauges into one Excel data file?
A42. Yes. Multiple rain gauges can be exported to a single Excel data file. Choose EXCEL as the File Type and Single File.
Q43. Can I Export both CSV files and Excel files from the Vault?
A43. Yes. There are now 2 File Types to choose in the Export Location feature.
Q44. Can I save my EXPORT parameters so I do not have to retype the information?
A44. Yes. There is a SAVE SETTINGS feature. Give your Settings information a name.
When you want to use it again, simply select Load Settings the next time you EXPORT.
PRISM Instructional Videos
PRISM Instructional Video Playlist
22 Videos
ADS PRISM Overview
15:13
How to Import Confirmations
from QStartXML into PRISM
2:07
How To Open a
Location Card in PRISM
1:28
PRISM Location Dashboard
Configuration Settings
3:03
How To Create a Composite
Location in PRISM
2:37
How to Create a
Location Group in PRISM
2:02
How to Import a Location
into PRISM from QstartXML
1:57
PRISM Alarm Notification Dashboard
2:20
How to View Historical Alarms in PRISM
1:21
How to Set Up the
Notifications Dashboard in PRISM
3:15
How To Remove a User from
the Notification Setup in PRISM
1:17
How To Set Up a Custom Dashboard in PRISM
2:50
How to Sign Up for Daily Battery
and Communications Reports in PRISM
1:55
How to Use the Maintenance Mode in PRISM
1:35
How to Create a Flow Balance Report in PRISM
3:32
How to Import Data into PRISM
1:18
How to Create an
ANSR Alarm in PRISM
3:33
How to Change the
Scale on a Hydrograph
2:10
PRISM 3.0 Home Page
3:06
ADS API 2023
2:39
How To Export Data with
Averaging in PRISM
2:22
How To Delete Files and
Folders in the Vault in PRISM
1:23
Login to the Official ADS PRISM Platform

Go to the official PRISM Platform
REQUEST ADDITIONAL INFORMATION
FIND YOUR SALES CONTACT

