Sewer Sociology
Sewers are an important part of our society. They serve to promote public health, protect the environment, and support economic growth within our communities. They also happen to provide a unique view into everyday life, and thus the connection between sewers and sociology.
Sewer Sociology® is defined as:
“The science of society, social institutions, and social relationships viewed through the eyes of a sewer; specifically: the systematic study of the development, structure, interaction, and collective sewer use of organized groups of human beings.”

Adapted from the Merriam-Webster Collegiate Dictionary
Eleventh Edition. Merriam-Webster, Springfield, MA
HEY, LET’S TALK ABOUT SEWER SOCIOLOGY
Sewer Sociology has direct applications to sewer design, hydraulic modeling, and real-time control:
- Forecasting sewer flow rates is an important part of sewer design, and these design assumptions are often based on published or regulated per capita values. A closer look reveals that the underlying assumptions are often limited and/or dated. Sewer Sociology offers the opportunity to confirm or update per capita sewer use for a variety of land use characteristics.
- Modeling dry weather sewer performance requires knowledge of anticipated diurnal patters from various land use areas, and the information available to hydraulic modelers in this regard is often limited. Sewer Sociology offers the opportunity to develop a library of diurnal patters to sharpen the performance of hydraulic models.
- Real-time alarming and real-time control of sewer systems requires knowledge of subtle shifts in diurnal patterns that naturally occur in sewer systems. It is a weekday or weekend? Is it a holiday? Are local schools in session or out for a break? All of these conditions result in unique signatures in sewer use patterns which can affect real-time alarming and real-time control.
- Higher sewer flows are observed early on New Year’s Day as people celebrate the arrival of the New Year. The morning rise also occurs later in the day as people recover from the night before.
- Martin Luther King, Jr. Day and President’s Day are government holidays. However, many businesses in the private sector remain open. As a result, the morning rise occurs earlier than a typical weekend as a certain percentage of the people wake at their normal weekday time and prepare for work.
- Memorial Day and Labor Day are quite similar, both with higher sewer flows during the late morning and early afternoon as people enjoy the holidays.
- Lower sewer flows are observed during the evening on Independence Day as many people depart to watch local fireworks displays.
- Thanksgiving Day provides the most notieceable deviation from typical weekday flows, with peak flows occuring around the time of the traditional Thanksgiving meal.
- Peak flows on Christmas Day are less than those observed on Thanksgiving. However, increases are observed around afternoon and evening meal times. Note also the higher sewer flows observed during the early morning hours, a traditional time when Santa Claus is believed to be busy delivering gifts.
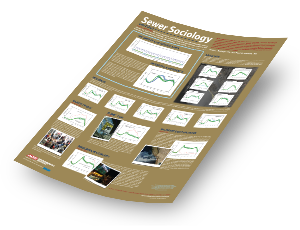
Download the High Resolution Sewer Sociology Posters:

SEWER SOCIOLOGY POSTER 2013

SEWER SOCIOLOGY POSTER (SAN DIEGO) 2013
Typical Four Week Hydrograph
This hydrograph displays flow monitor data from a residential area recorded over a four week period during normal dry weather conditions. Note that a repeatable daily or diurnal pattern is observed.

How Events Affect Sewer Flow Patterns
The Powerful Perception Behind Sewer Sociology

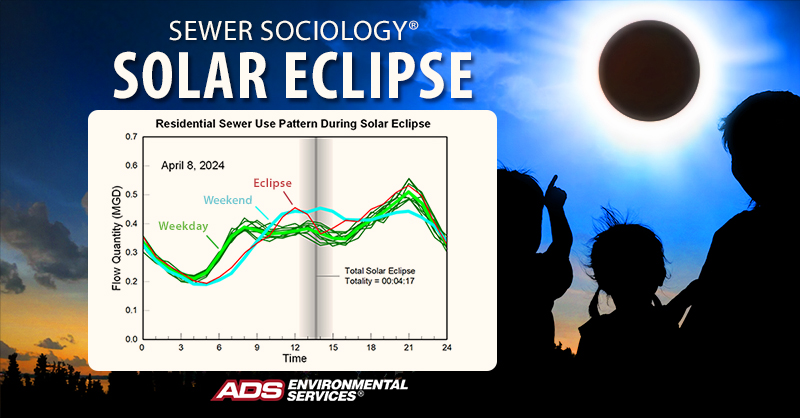
April 8, 2024: Total Solar Eclipse
Did you catch the solar eclipse on Monday? I sure did . . . through the eyes of a sewer. A total solar eclipse is a big deal and generates a lot of interest. This means that a sewer sociologist smells a good story. Take a look.
Sewer use from a residential area in Central Texas located in the path of totality is shown in the graph below. Typical weekdays are shown in green. Typical weekends are shown in blue, and the day of the solar eclipse is shown in red. Note that even though the eclipse occurred on a weekday, this day starts out like a weekend as schools were canceled for the day and many people took the day off. Totality occurred around 1:30 PM, and sewer use decreased accordingly as residents took a collective pause to enjoy this unique celestial event. After the eclipse, sewer use returned to its normal weekday pattern as life returned to normal.

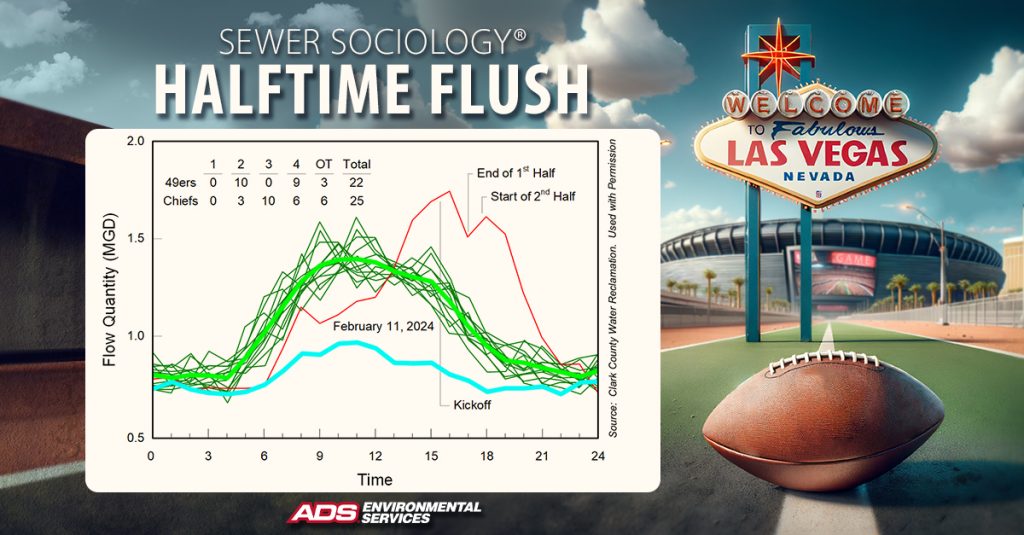
February 11, 2024: While tens of thousands of exhilarated fans descended upon Super Bowl LVIII in Las Vegas and millions more gathered to watch the game on television, I settled in as a Sewer Sociologist to watch the game through the eyes of a sewer.
Sewer use from the venue and the surrounding area is shown in the graph below. Typical weekdays are shown in green. Typical weekends are shown in blue, and game day is shown in red. The difference between the red curve and the blue curve is the added flow attributed to the Super Bowl.
Sewer flows increase dramatically as fans arrive at the stadium. However, note how flows decrease after kickoff as they settle in and focus on the game. Flows increase a bit during halftime – resulting in a modest halftime flush – and decrease again as play resumes in the second half. This game was close and well-contested by both teams. The Chiefs (and Taylor Swift) are happy with a Super Bowl win, and I am happy with another Sewer Sociology win!
Sewer Sociology White Papers
The Days of Our (Sewer) Lives
San Diego 2013
PDF Link
Royal Wedding of Prince William and Kate Middleton

April 29, 2011 was a big day for the British – the much-anticipated Royal Wedding of Prince William and Kate Middleton.
A Royal Wedding is the type of event that captivates a nation and reveals itself in sewer data. This flow monitor data from a residential area near London reveals how the Royal Wedding affected the population. The wedding took place on a designated Bank Holiday. To a sewer sociologist, a holiday looks much like a weekend, so we determine the effect of the Royal Wedding on sewer use by comparing the wedding day to a typical weekend.
Note that sewer flows depart from normal soon after the first guests arrive at Westminster Abbey, as many residents deviate from their routine to tune in to television coverage. Residential flows return to normal by 2:00 PM, about half an hour after the Royal Kiss on the balcony at Buckingham Palace.
The Australian Open is held each year in Melbourne, Australia and is one of four Grand Slam tennis tournaments, attracting top-ranked professional and junior players from around the world. Flow monitoring data from the 2006 Australian Open are shown below and provide a recap of the tournament from a sewer’s perspective. Attendance figures for each day of the tournament are provided for comparison.
This data was obtained from a flow monitor located just downstream from Melbourne Park — home to the Australian Open. Melbourne Park provides a world-class venue for competitive tennis, and key features of the venue are summarized below:
The Australian Open encompassed a total of 631 matches contested on 17 different courts during 14 days of competition — including 12 day sessions, 11 night sessions, and two twilight sessions.
Sewer flow rates observed during several days of the tournament are compared to average dry day flows on the composite hydrographs shown below. Dry day flows were obtained after the tournament during February 2006 when no other events were scheduled at Melbourne Park. Flows directly associated with the Australian Open are determined by subtracting each tournament day flow from the average weekday of weekend flow. Note that peak sewer flows occur just before the start of major matches and are most pronounced for the men’s singles finals.
According to tournament officials, patrons consumed more than 37,247 buckets of hot chips, 37,305 barbeque sausages, 5,500 pounds of curry, 164,416 ice creams, 200,821 bottles of water, and 110,685 espresso coffees. According to the flow monitor, they also generated 2,204,000 gallons of wastewater. With a reported attendance of 550,500, this results in a sewer use rate of 4.0 gallons/day/person over the duration of the tournament — consistent with the sewer use rate observed at college football games in the United States.
References:
Tennis Australia (2006). The Australian Open — History of Attendance, Australian Open; Melbourne, Australia.
Tennis Australia (2006). 2006 Tournament Information, Australian Open; Melbourne, Australia.
Tennis Australia (2006). Australian Open 2006 Schedule of Play, Australian Open; Melbourne, Australia.
Acknowledgement:
Special thanks are extended to City West Water for contributing this flow monitoring data and authorizing its use for this purpose.
College football games are big-time events in big-time college towns as students, alumni, and fans descend upon campus for a day of spirited festivities. Flow monitoring data from Tallahassee, Florida — home to Florida State University (FSU) — are shown below and provide a glimpse into the world of college football.
This data was obtained during a portion of the 2005 football season at a monitoring location downstream from the Florida State University campus. The FSU football schedule and the outcome of each regular season game are provided below for reference.
Flow rates at this location show a dramatic increase on three occassions which happen to correspond to three home football games at Doak Campbell Stadium. The flow rates observed during these three games are compared to average dry day flows on the composite hydrographs shown below.
All three games began in the early afternoon, and as expected, sewer flows began to increase a few hours prior to kickoff. During the Maryland and North Carolina State games, two distinct flow increases were observed that coincide with halftime and the end of the game. Note, however, that the same pattern was not observed during the Wake Forest game. A review of the final score reveals that Wake Forest was routed 41-24 by FSU. The flow monitoring data reveal that fans began to depart the stadium early in the game. The final scores from the other two games were much closer — resulting in on win and one loss for FSU.
Flow directly associated with the stadium are determined by subtracting each game day flow from the average weekend flow. The Maryland and North Carolina State games generated an additional 304,000 gallons of flow. With a stadium capacity 82,300, this results in a sewer use rate of 3.7 gallons/day/seat — comparable to the 4 gallons/day/seat sewer use estimates used for other stadium development projects.
References:
Purinton, J. Editor (2005). Florida State Seminoles 2006 Orange Bowl Media Guide, Florida State University, Department of Intercollegiate Athletics; Tallahassee, FL.
Christopher A. Joseph & Associates (2003). Los Angeles Memorial Coliseum Renovation Project Draft Environmental Impact Report; Los Angeles, CA.
Acknowledgement:
Special thanks are extended to the City of Tallahassee for contributing this flow monitoring data and authorizing its use for this purpose.
Holidays are welcomed diversions from everyday life and provide time to celebrate and relax with family and friends. These diversions are reflected in sewer use patterns, as shown below. Flow monitoring data from several familiar holidays are displayed in comparison with normal weekday and weekend sewer use patterns. To a sewer sociologist, a holiday looks much like a weekend. However, characteristic differences are observed that make each holiday unique. See what differences you can find and how they compare with your holiday traditions.
These composite hydrographs are interpreted by noting the differences between the average weekend curve and the holiday of interest. Several interesting observations are noted:
Hurricane Rita entered the Gulf of Mexico on September 21, 2005 and strengthened to a powerful Category 5 hurricane. No less that a month before, Hurricane Katrina had devastated New Orleans and other surrounding coastal communities. This time, storm-weary residents were not taking any chances.
Early forecasts for Hurricane Rita included the metropolitan Houston area — with a population in excess of five million — prompting one of the largest evacuations in U.S. history. Media reports indicate that the ensuing evacuation involved more than two million people in Texas alone. The composite hydrograph shown below displays normal dry weather flow from a flow monitor located in Houston during this time period. Flow monitoring data from September 22nd, the evacuation day, are also provided.
Assuming that the average dry day flow is directly related to population, approximately 36% of the residents in this area fled within two days of landfall. After the evacuations, Hurricane Rita turned northward and made landfall as a Category 3 hurricane on September 24th near Sabine Pass along the Texas-Louisiana border. Ironically, National Weather Service data from the Houston Intercontinental Airport indicate that this area received sustained winds of only 40 miles per hour and rainfall totals less than one inch. Houston had been spared. Sewer flows within this area returned to normal within a few days as residents returned home.
References:
Mulrine, A. Marek, A.C., and Querna, B. (2005). ‘Not Again,’ U.S. News & World Report, Volume 139, Issue 12, 22-27.
Knabb, R.D., Brown, D.P. and Rhome, J.R. (2006). Tropical Cyclone Report — Hurricane Rita, National Hurricane Center, Tropical Prediction Center; Miami, FL.
Acknowledgement:
Special thanks are extended to the City of Houston for contributing this flow monitoring data and authorizing its use for this purpose.
Land use within a particular area can impact the shape of the diurnal pattern. The examples below represent diurnal patterns from six different land use areas. The residential pattern is the most common. Combinations and variations of these patterns are often observed in mixed land use areas. Industrial patterns are industry specific and come in many varieties. The industrial example provided here is from a meat processing facility that perfoms cleaning operations during the third shift.
Millions of people were left without power on August 14, 2003 at 4:09 PM when the largest blackout in the history of North America occurred. The blackout began when three transmission lines failed near Cleveland, Ohio. Within minutes, over 100 power plants in the United States and Canada were overwhelmed and knocked offline.
The blackout affected several major metropolitan areas — including Detroit, Cleveland, Columbus, New York, Toronto, and Ottawa. This composite hydrograph displays normal dry weather conditions from a flow monitoring located in Oakland County, Michigan during this period. Flow monitoring data from August 14th are shown for comparison.
Note the dramatic drop in flow after the power failure. The minimum flow during the blackout was well below the normal night-time flow. This example illustrates how the disruption of one basic service can affect the use of another.
References:
Gibbs, N. (2003). ‘Lights Out,’ Time, Volume 162, Issue 8, 30-39.
Acknowledgment:
Special thanks are extended to the Oakland County Drain Commissioner for contributing this flow monitoring data and authorizing its use for this purpose.
Certain religious practices can also be observed in sewer use patterns. This composite hydrograph shows normal dry weather flow patterns from a flow monitor located in a region with a prominent Orthodox Jewish population. The sewer use on Fridays is quite different from other weekdays. The sewer use pattern observed on Friday, August 26, 2005 is shown for comparison.
The Jewish Sabbath, or Shabbat, begins at dusk on Friday evening. However, preparations such as shopping, cooking, cleaning, and bathing start much earlier and must be completed by dusk. The Jewish Sabbath is a time of worship, reflection, and rest, and other activities are limited during this period. Preparation for the Sabbath and rest that follows are reflected in the sewer use pattern each Friday. These patterns are repeatable from week to week. However, peak flows do shift with changing sunset times.
References:
Klagsbrun, F. (1996). Jewish Days — A Book of Jewish Life and Culture Around the Year, Farrar Straus Giroux; New York, NY.
September 11, 2001 is a defining moment in U.S. history, and its memories and emotions echo through the words of the 9/11 Commission:
At 8:46 on morning of September 11, 2001, the United States became a nation transformed. An airliner traveling at hundreds of miles per hour and carrying some 10,000 gallons of jet fuel plowed into the North Tower of the World Trade Center in Lower Manhattan. At 9:03, a second airliner hit the South Tower. Fire and smoke billowed upward. Steel, glass, ash, and bodies fell below. The Twin Towers, where up to 50,000 people worked each day, both collapsed less than 90 minutes later . . . More than 2,600 people died at the World Trade Center . . . [and] the death toll surpassed that at Pearl Harbor in December 1941.
This composite hydrograph offers a unique perspective on the events of September 11th as observed by a flow monitor located near the World Trade Center.
Note that this day started out like any normal day. That all changed at 8:46 AM when terrorists flew American Airlines Flight 11 into the North Tower of the World Trade Center. Much of Manhattan, including this area, was evacuated as rescue and recovery efforts began. This clearly was not a normal or average day. Instead, this flow monitor has documented its own account of a historic tragedy from a unique perspective. Although the perspective is different, the story remains compelling.
References:
National Commission on Terrorist Attacks Upon the United States (2004). The 9/11 Commission Report, Government Printing Office; Washington, DC.
Acknowledgment:
Special thanks are extended to the New York City Department of Environmental Protection for contributing this flow monitoring data and authorizing its use for this purpose.
The Australian Open is held each year in Melbourne, Australia and is one of four Grand Slam tennis tournaments, attracting top-ranked professional and junior players from around the world. Flow monitoring data from the 2006 Australian Open are shown below and provide a recap of the tournament from a sewer’s perspective. Attendance figures for each day of the tournament are provided for comparison.
This data was obtained from a flow monitor located just downstream from Melbourne Park — home to the Australian Open. Melbourne Park provides a world-class venue for competitive tennis, and key features of the venue are summarized below:
The Australian Open encompassed a total of 631 matches contested on 17 different courts during 14 days of competition — including 12 day sessions, 11 night sessions, and two twilight sessions.
Sewer flow rates observed during several days of the tournament are compared to average dry day flows on the composite hydrographs shown below. Dry day flows were obtained after the tournament during February 2006 when no other events were scheduled at Melbourne Park. Flows directly associated with the Australian Open are determined by subtracting each tournament day flow from the average weekday of weekend flow. Note that peak sewer flows occur just before the start of major matches and are most pronounced for the men’s singles finals.
According to tournament officials, patrons consumed more than 37,247 buckets of hot chips, 37,305 barbeque sausages, 5,500 pounds of curry, 164,416 ice creams, 200,821 bottles of water, and 110,685 espresso coffees. According to the flow monitor, they also generated 2,204,000 gallons of wastewater. With a reported attendance of 550,500, this results in a sewer use rate of 4.0 gallons/day/person over the duration of the tournament — consistent with the sewer use rate observed at college football games in the United States.
References:
Tennis Australia (2006). The Australian Open — History of Attendance, Australian Open; Melbourne, Australia.
Tennis Australia (2006). 2006 Tournament Information, Australian Open; Melbourne, Australia.
Tennis Australia (2006). Australian Open 2006 Schedule of Play, Australian Open; Melbourne, Australia.
Acknowledgement:
Special thanks are extended to City West Water for contributing this flow monitoring data and authorizing its use for this purpose.
College football games are big-time events in big-time college towns as students, alumni, and fans descend upon campus for a day of spirited festivities. Flow monitoring data from Tallahassee, Florida — home to Florida State University (FSU) — are shown below and provide a glimpse into the world of college football.
This data was obtained during a portion of the 2005 football season at a monitoring location downstream from the Florida State University campus. The FSU football schedule and the outcome of each regular season game are provided below for reference.
Flow rates at this location show a dramatic increase on three occassions which happen to correspond to three home football games at Doak Campbell Stadium. The flow rates observed during these three games are compared to average dry day flows on the composite hydrographs shown below.
All three games began in the early afternoon, and as expected, sewer flows began to increase a few hours prior to kickoff. During the Maryland and North Carolina State games, two distinct flow increases were observed that coincide with halftime and the end of the game. Note, however, that the same pattern was not observed during the Wake Forest game. A review of the final score reveals that Wake Forest was routed 41-24 by FSU. The flow monitoring data reveal that fans began to depart the stadium early in the game. The final scores from the other two games were much closer — resulting in on win and one loss for FSU.
Flow directly associated with the stadium are determined by subtracting each game day flow from the average weekend flow. The Maryland and North Carolina State games generated an additional 304,000 gallons of flow. With a stadium capacity 82,300, this results in a sewer use rate of 3.7 gallons/day/seat — comparable to the 4 gallons/day/seat sewer use estimates used for other stadium development projects.
References:
Purinton, J. Editor (2005). Florida State Seminoles 2006 Orange Bowl Media Guide, Florida State University, Department of Intercollegiate Athletics; Tallahassee, FL.
Christopher A. Joseph & Associates (2003). Los Angeles Memorial Coliseum Renovation Project Draft Environmental Impact Report; Los Angeles, CA.
Acknowledgement:
Special thanks are extended to the City of Tallahassee for contributing this flow monitoring data and authorizing its use for this purpose.
